Nanoparticles
Small-angle X-ray scattering is a powerful means to study nanoparticles. With its help it is possible to determine their shape or size distribution with higher accuracy than other methods, e.g. from TEM images. The reason for this is that the number of investigated particles is much higher in SAXS (because of the typically 1 mm3 irradiated sample volume) than TEM (only a few hundreds of particles in each image), and the measurement is free from artifacts introduced by sample preparation and measurements inherent in the latter method.
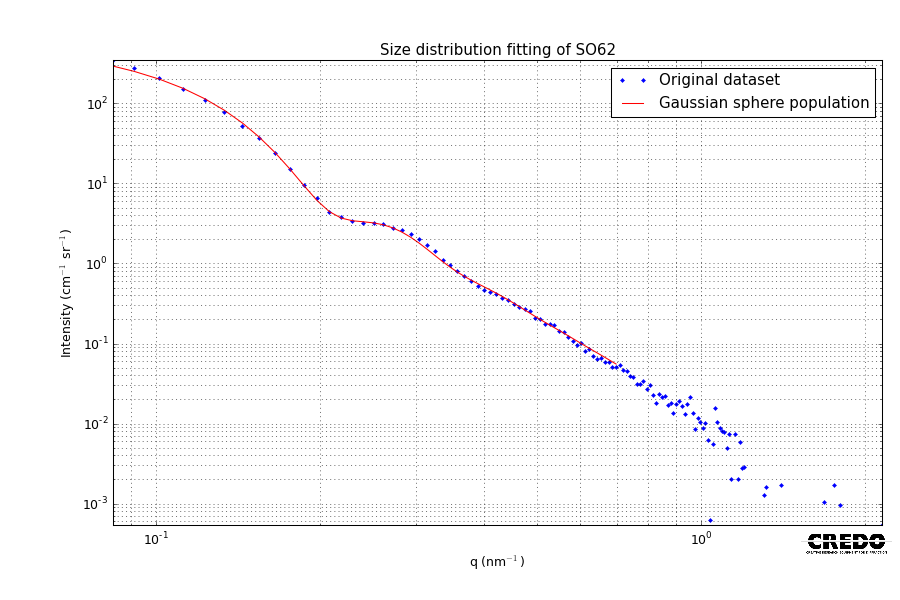
The following images show a typical scattering curve of a stable suspension of nearly monodisperse SiO2 nanoparticles (dotted curve) and a least squares fit of the scattering of a population of spheres with radii sampled from a Gaussian distribution (red continuous line). The scattering curve starts with the so-called Guinier region, then continues with a damped oscillation of the sphere form factor.
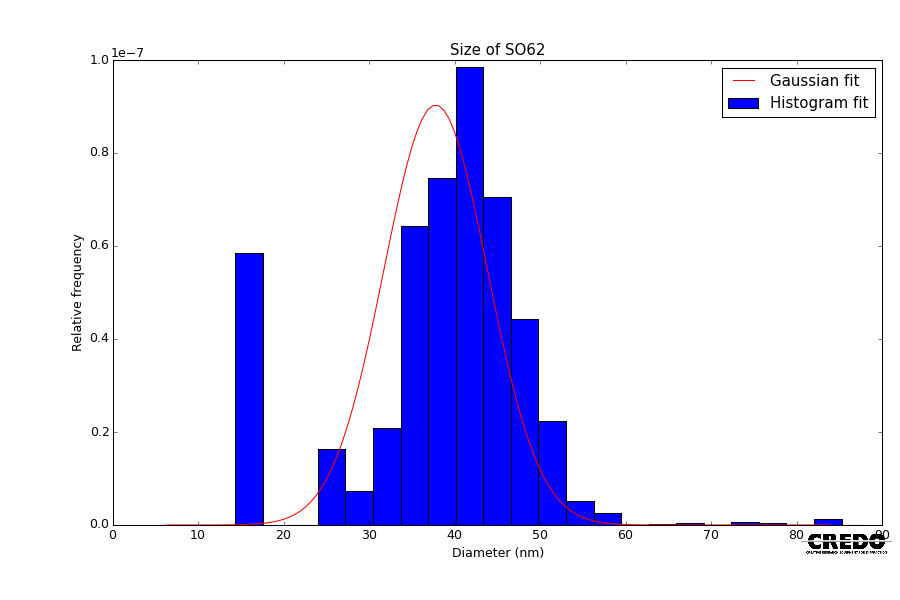
The size distribution, which has been determined using this method is shown in the next figure. The continuous red line shows the distribution of diameters of the fitted sphere population in the previous diagram. The blue histogram is the result of a model-free approach.
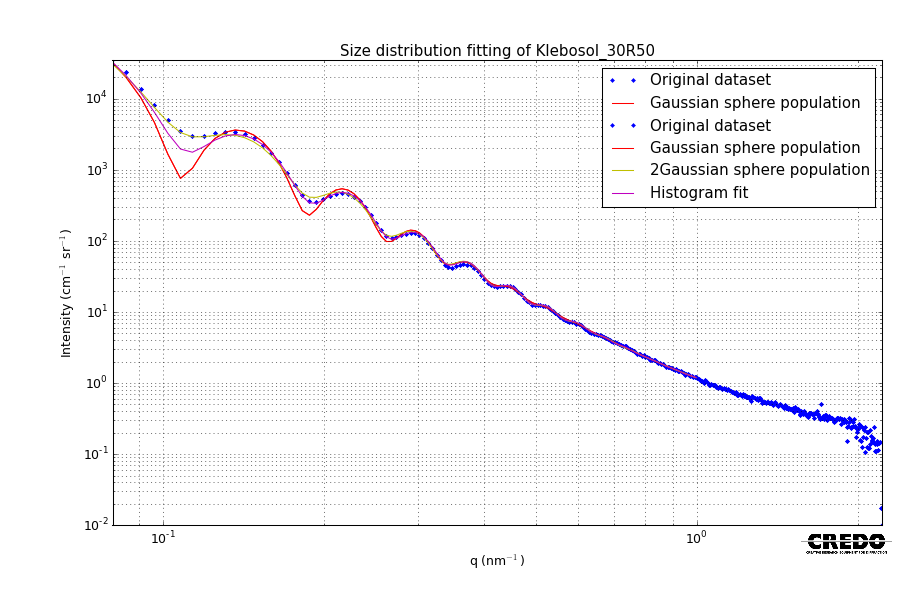
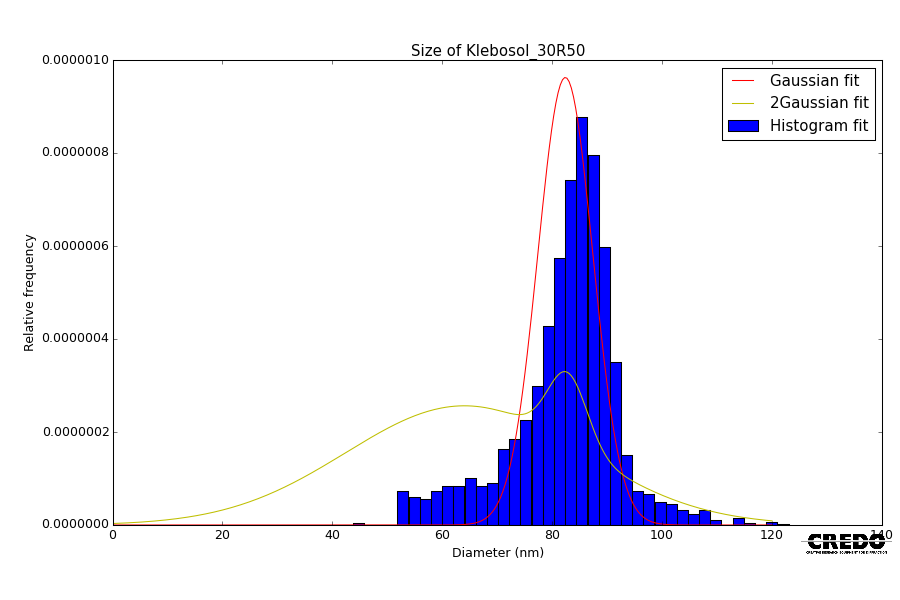
In special cases, where the nanoparticles are highly monodisperse, i.e. the oscillations from the sphere form factor are pronounced, the size distribution can be reliably determined even when the Guinier range is not visible, i.e. the particles are large. This is illustrated in the scattering pattern and the resulting size distribution of Klebosol 30R50, a commercially available silica suspension.